Inverse Proportion and The Hyperbola Graph
Hyperbola graphs, like the one immediately below, show that the quantities on the graph are in inverse proportion. This graph states, therefore, that A is inversely proportional to B. (It also states that B is inversely proportional to A, but we are going to work with the statement 'A is inversely proportional to B'.)
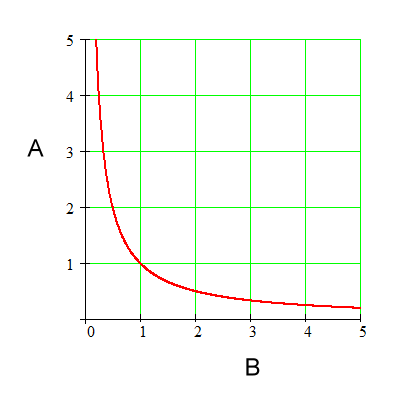
For the above graph:
|
|
This is how you write an inverse proportion. The symbol in the middle is the Greek letter alpha. It reads: A is inversely proportional to B. It means: By whatever factor A changes, B changes by the inverse of that factor. (Or you could say, “by the reciprocal of that factor”.) |

Well, let's examine the graph and find
out if its shape is such that A and B change by inverse factors.
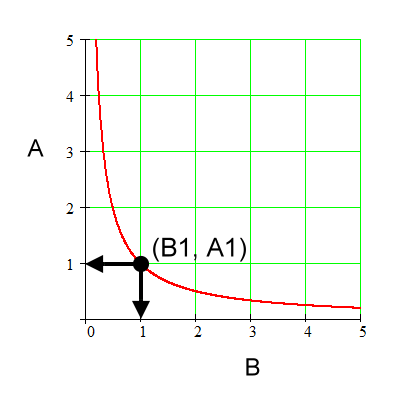
Below is an example of a point on this
graph. The point is (B1, A1) and it has coordinates (1, 1).
For the above graph:
|
|
Coordinate for B1. |
|
|
Coordinate for A1. |
We will check for this hyperbola shape
of a graph if we change A by some factor, does B truly change by the
inverse factor, thus showing that this hyperbola shape represents an
inverse proportion.
Here's what we are looking for:
The explanation:
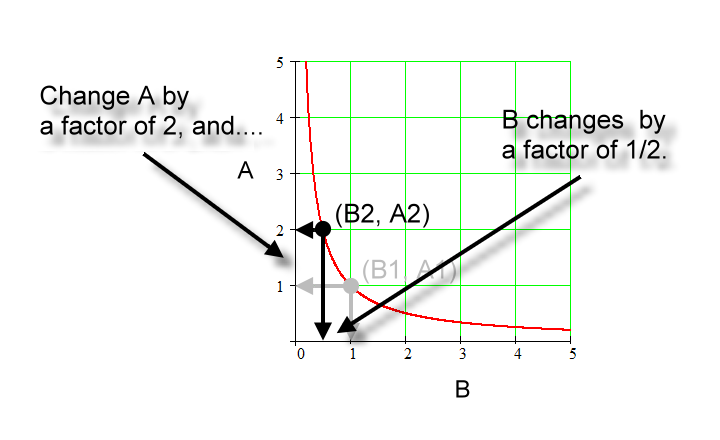
In the graph below we go from 'sub 1'
to 'sub 2' and change the quantity A by a factor of 2; that is, we
double it.
For the above graph:
|
|
Coordinates for (B1, A1). |
|
|
Coordinates for (B2, A2). |
|
|
Going from 'sub 1' to 'sub 2', A changes by a factor of 2. That is, A1 times a factor of 2 equals A2. |
|
|
Going from 'sub 1' to 'sub 2' B, changes by a factor of 1/2. B1 times a factor of 1/2 equals B2. |
|
|
A and B change by the inverse factors. Those factors are 2 and ½ respectively. |
|
|
Therefore, A is inversely proportional to B. |
So, again:
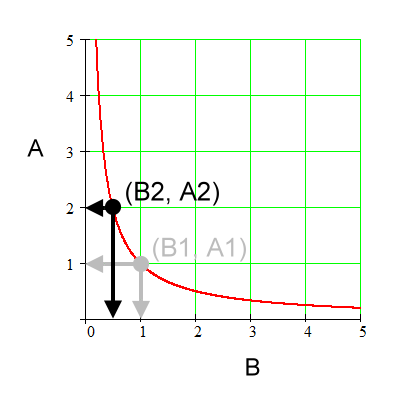
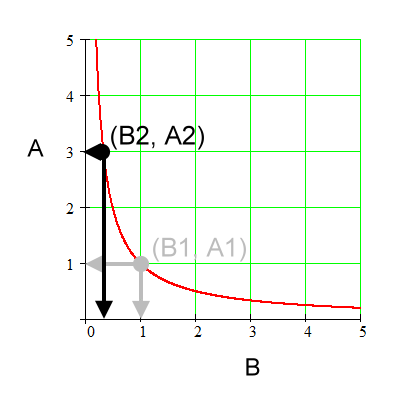
Let's try this again below for another point
using the same graph. Here's where we are headed:
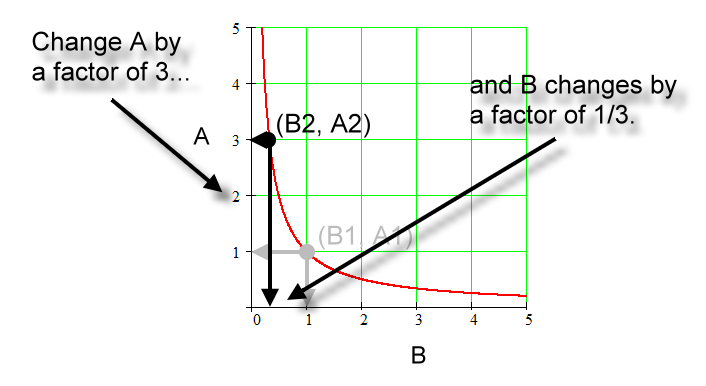
The steps follow as we move from 'sub
1' to 'sub 2':
For the above graph:
|
|
Coordinates for (B1, A1). |
|
|
Coordinates for (B2, A2). |
|
|
Going from 'sub 1' to 'sub 2', A changes by a factor of 3. |
|
|
Going from 'sub 1' to 'sub 2', B changes by a factor of 1/3. |
|
|
A and B change by inverse factors. Those factors are 3 and 1/3 respectively. |
|
|
Therefore, A is inversely proportional to B. |
Here's the picture once more:
And again, if A is inversely proportional to B, then B is inversely proportional to A. The logic works out the same.
The function on the graph is:

Or, using a formal function definition:
Lastly, this:

could probably be read 'A is directly proportional to the inverse of B', but that would be unusual. It's 'A is inversely proportional to B'.