Simple Rational Function: f(x) = 1/x
This is probably the simplest of rational functions:
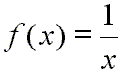
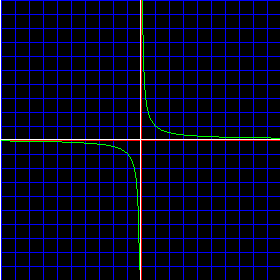
Here is how this function looks on a graph with an x-extent of [-10, 10] and a y-extent of [-10, 10]:
First, notice the x- and y-axes. They are drawn in red.
The function, f(x) = 1 / x, is drawn in green.
Also, notice the slight flaw in graphing technology which is usually seen when drawing graphs of rational functions with computers or graphic calculators. At the bottom center of the picture you will see that the graph line appears to be heading toward the edge of the diagram, but is cut short of that. Actually, the true graph of the function continues downward past the edge of the picture. As we will shortly see, this section of the graph holds what is termed an asymptote, and computers, along with graphic calculators, often have a difficult time drawing functions near asymptotes.
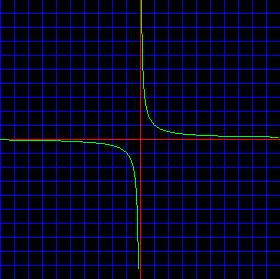
Notice that for this function a small positive input value yields a large positive output value. And notice that a large positive input value yields a small positive output value. Here is a picture showing that:
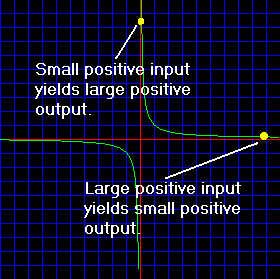
A complementary situation occurs for negative values. A small negative input will output a large negative value, and a large negative input will output a small negative value. Here is a picture showing this idea:
This makes complete sense if you think about it for a moment. Consider the input x to have a large positive value, say one million (1,000,000). The output of f(x) = 1/x would be one millionth (1/1,000,000 or 0.000001).
This and other representative examples are shown in the following table:
| Input value, or x | Output value, or y | |
| 1,000,000 | ⇒ | 0.000001 (or 1/1,000,000) |
| 0.000001 (or 1/1,000,000) | ⇒ | 1,000,000 |
| -1,000,000 | ⇒ | -0.000001 (or -1/1,000,000) |
| -0.000001 (or -1/1,000,000) | ⇒ | -1,000,000 |
Let us look at this function as it leaves the graph at the top and bottom. You should notice that the green function line approaches, but does not touch, the y-axis.
If you graphed the function on a set of x, y axes that went up to positive one million and down to negative one million, the function line would still not touch the y-axis, though it would get very close.
Just think about the x, y values in the table above. At, say, an output value, or y value, of 1,000,000 the input would not be 0. And, of course, the input value, or x value, must be 0 for the graph to touch the y-axis.
This type of behavior about the y-axis is called asymptotic behavior. And, in this case, the y-axis would be called a vertical asymptote of the function. That is, the function approaches the y-axis ever closer and closer, but never touches it.
Notice that the x-axis functions as a horizontal asymptote for this function. That is, as the function line stretches out to the left or right it gets closer and closer to the x-axis, but it never touches it.
So, for the function f(x) = 1/x the y-axis is a vertical asymptote, and the x-axis is a horizontal asymptote. In the following diagram of this function the asymptotes are drawn as white lines.
The function f(x) = 1/x is an excellent starting point from which to build an understanding of rational functions in general. It is a polynomial divided by a polynomial, although both are quite simple polynomials. Be sure that you understand the concept of an asymptote, especially a vertical asymptote, and then go on to the other rational function information.