Direct Proportion and The Straight Line Graph
Straight line graphs that go through
the origin, like the one immediately below, show that the quantities
on the graph are in direct proportion. This graph states, therefore,
that A is directly proportional to B. It also states
that B is directly proportional to A, but we are going to work with the
statement 'A is directly proportional to B'.
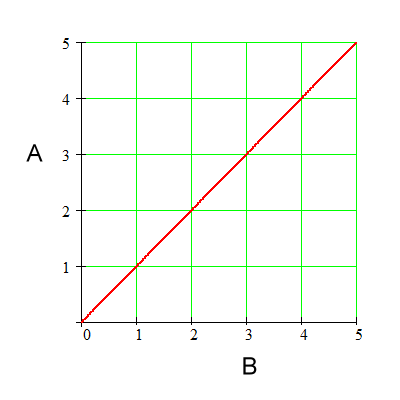
For the above graph:
|
|
This is how you write a direct proportion. The symbol in the middle is the Greek letter alpha. It reads: A is directly proportional to B. It means: By whatever factor A changes, B changes by the same factor. |
So, let's look at the graph and see if by whatever factor A changes, B changes by the same factor.
This is what we are looking for, as we go from 'sub 1' to 'sub 2':
About the factor changes:
Below is an example of a point on this graph. The point is (B1, A1) and it has coordinates (1, 1).
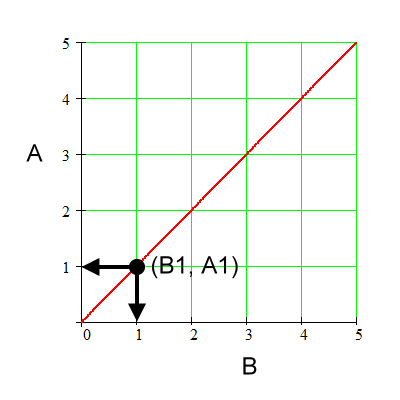
For the above graph:
|
|
Coordinate for B1. |
|
|
Coordinate for A1. |
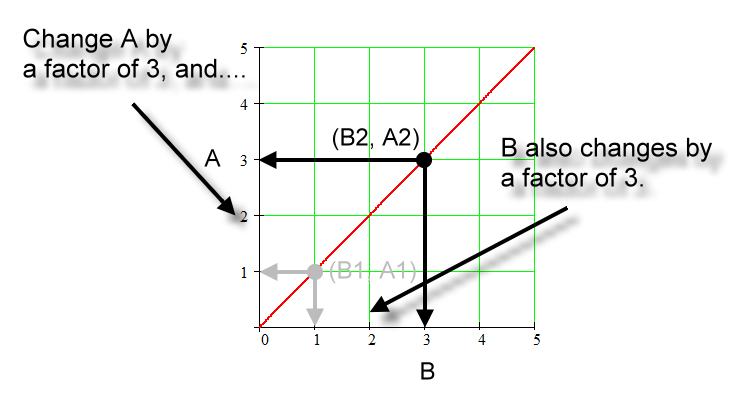
We will check for this shape of a graph if we change A by some factor, does B truly change by the same factor, thus showing that this straight line through the origin represents a direct proportion. In the graph below we change the quantity A by a factor of 3; that is, we triple it.
For the above graph:
|
|
Coordinates for (B1, A1). |
|
|
Coordinates for (B2, A2). |
|
|
Going from 'sub 1' to 'sub 2', A changes by a factor of 3. That is, A1 times a factor of 3 equals A2. |
|
|
Going from 'sub 1' to 'sub 2', B also changes by a factor of 3. Likewise, B1 times a factor of 3 equals B2. |
|
|
Both A and B change by the same factor. That factor is 3. |
|
|
Therefore, A is directly proportional to B. |
Again, the picture:
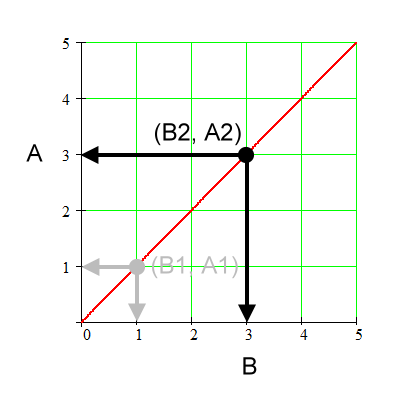
Let's try this below again for another
point using the same graph. Here's the picture:
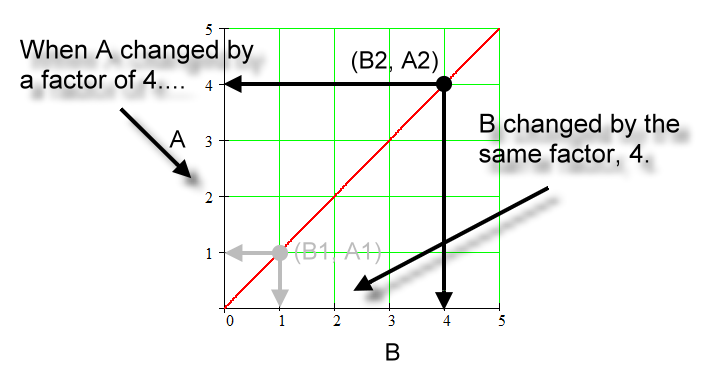
These steps show the factor changes:
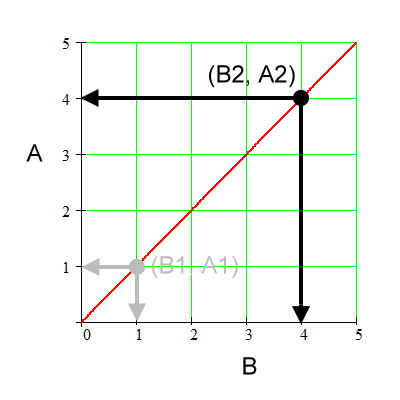
For the above graph:
|
|
Coordinates for (B1, A1). |
|
|
Coordinates for (B2, A2). |
|
|
Going from 'sub 1' to 'sub 2', A changes by a factor of 4. |
|
|
Going from 'sub 1' to 'sub 2', B also changes by a factor of 4. |
|
|
Both A and B change by the same factor. That factor is 4. |
|
|
Therefore, A is directly proportional to B. |
Again:
This straight line graph really tells two stories. If you can say that A is directly proportional to B, then you can state that B is directly proportional to A. The above works out the same.
The function in the graph used here is:
![]()
Or, using formal function definition writing:
![]()
Lastly:
If someone says, 'A is proportional to B', they most assuredly mean, 'A is directly proportional to B'. Some might feel that the constant inclusion of the word 'direct' is unnecessary. It does, though, get to exactly what you are talking about, because there are other types of proportions.