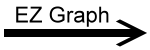
EZ Graph - Ellipse
The equation for an ellipse on the (x, y) plane looks like this:
The following EZ Graph program draws an ellipse based on the above equation. Click the 'Draw graph' button on EZ Graph to see the ellipse. In order to complete the drawing, you will probably have to click 'OK' on a couple of harmless popup error messages; so be sure you do that. One popup message happens as soon as you press 'Draw graph'. Explanations for the errors and more are below.
How this works with EZ Graph: First, we must rearrange the equation so that the graphic calculator can work with it. We have to get the equation to read like this:
y = some function of x
So we have to solve the equation for y. Here's that solution:
|
|
The starting equation |
 |
Subtract x2/a2 from each side. |
 |
Multiply each side by b2. |
 |
Take the square root of both sides. Solve for the positive square root. |
 |
And also solve for the negative square root. |
EZ Graph syntax: Now we will take a look at how the above equations are represented in EZ Graph.
 f1(x) = sqrt(b^2 * (1 - (x^2 / a^2)))
f2(x) = -sqrt(b^2 * (1 - (x^2 / a^2)))
So, we have what we need to graph the ellipse: two equations, or functions of x. The first (with the positive square root) will draw the top half of the ellipse, and the second (with the negative square root) will draw the bottom half of the ellipse. Note that these are the two functions entered into EZ Graph for f1(x) and f2(x). If you remove the check next to one of these functions, that function will not be drawn, and you will see only half of an ellipse.
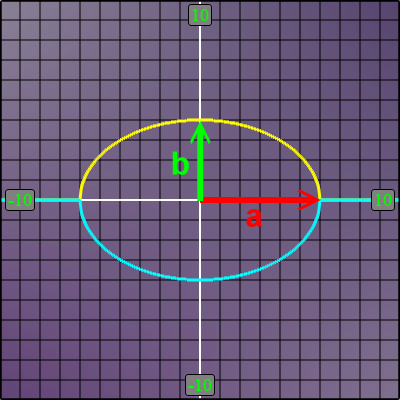
About the variables a and b in the equation: The variables a and b are respectively the horizontal and vertical radii as shown in this diagram:
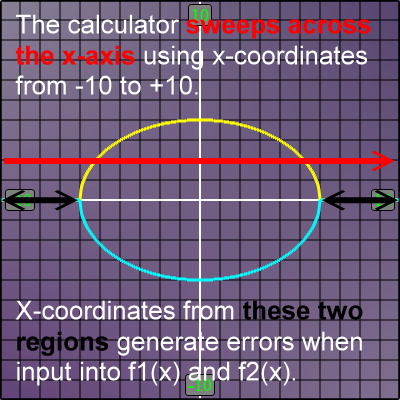
About the error messages: When the graphic calculator draws any function, it attempts to use several closely spaced x-coordinates along the x-axis, sweeping across the x-axis left to right (from -10 to +10 in this case). The problem is that not all of these x-coordinates are in the domain of the currently defined functions f1(x) and f2(x), as shown here:
With our example, when you press 'Draw graph', the calculator begins its x-axis sweep, and the first x-coordinate it finds is -10. The calculator uses this x-coordinate as an input for f1(x) in order to find a corresponding y-coordinate. Using values for our ellipse, a=6 and b=4, the calculation for the y-coordinate for f1(x) with x=-10 looks like this:
Now, look under the square root sign. We find this negative value:
The value is negative because 1 is less than 100/36 (100/36 = about 3). This negative value makes the whole argument to the square root negative, and that generates the error, happening right at the start of the graph drawing.
When EZ Graph spots such a error, it posts a message about the error and makes the y-coordinate equal to 0. It continues to sweep across the x-axis after posting the error message. If EZ Graph finds another identical error while drawing the function (and it will, say, at x=-9.9), it does not post another error message, but it does set y=0 again. This process lets you know if an error has occurred in your graph, and still allows you to draw shapes like an ellipse (knowing that the full graph has some understandable problems).
In our ellipse example here, this type of error happens for both f1(x) and f2(x).
Related: