Help for EZ Graph
Where the graph appears:
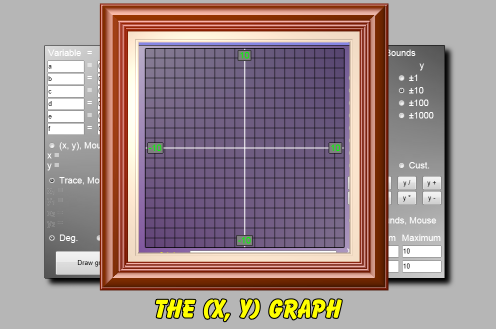
When you draw an (x, y) graph, it will appear here. Note that the bounds for the x- and y-axes appear on the graph.
How to tell EZ Graph what function you want it to draw:
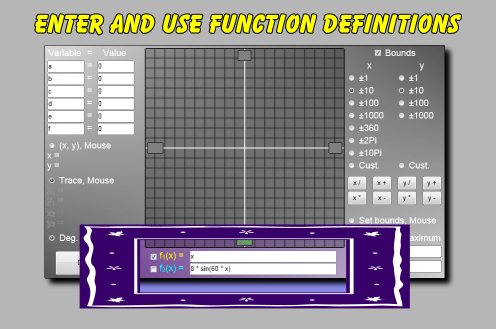
You can draw two functions at once with EZ Graph. One function is named f1, the other f2. They are both 'of x', so x is the input variable for both functions.
You type the definitions of the functions into these text boxes. There is a checkbox to the left of each function name that controls if that function will be drawn or not.
Each function name, f1 or f2, has its own color. The function graph will be drawn in the same color as its name's color.
How to draw the graph:
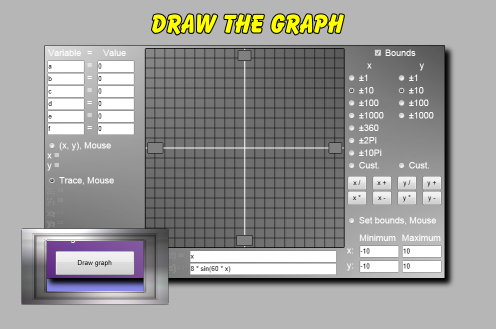
Click this button to draw the graphs of the functions. There are two function definitions. Only the definitions with their checkbox checked will be drawn.
Several other operations within EZ Graph, such as updating the graph's bounds, cause the functions to automatically be redrawn without clicking this button.
How to use variables in your function definitions:
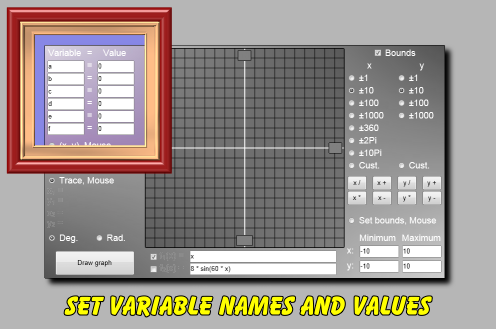
Your function definitions can include variables (other than x). You enter the name and value for these variables in this section.
For example, if you were drawing a common linear function that in algebra notation would look like this:
f1(x) = mx + b
And in EZ Graph notation would look like this:
f1(x) = m*x + b
Then you would need to create two variables with the names 'm' and 'b' and assign them values in this area. Perhaps you would type in:
m = 2
b = 3
How to find the (x, y) coordinates for any point on the graph:
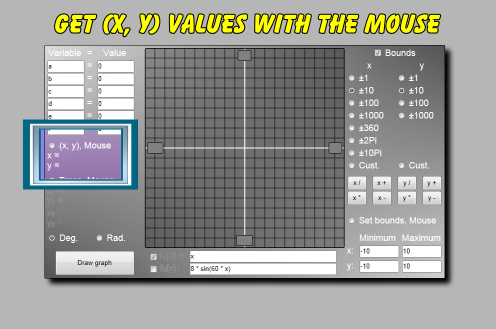
The mouse can do three jobs in EZ Graph:
- Give you the (x, y) coordinates anywhere on the graph area.
- Give you the accurate (x, y) coordinates at a certain x-coordinate on the functions' lines.
- Let you set the bounds for the (x, y) graph.
If you click this radio button, and then click the graph area anywhere, the x- and y-coordinates for that point will be shown here. A small point symbol will be drawn on the graph where you clicked.
You can click the graph several times to get the coordinates of several points.
How to show or hide the bounds display on the graph:
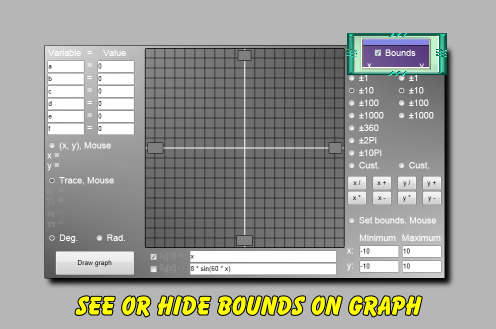
The checkbox next to the 'Bounds' label controls the visibility of the bounds that appear on the graph area.
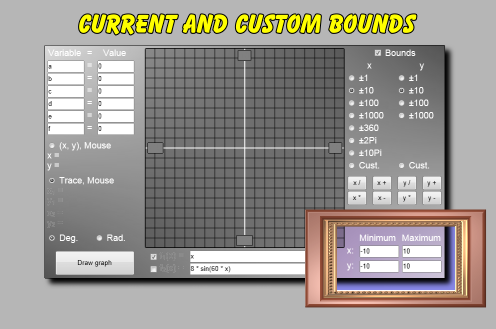
How to easily adjust the graph's bounds to several common values:
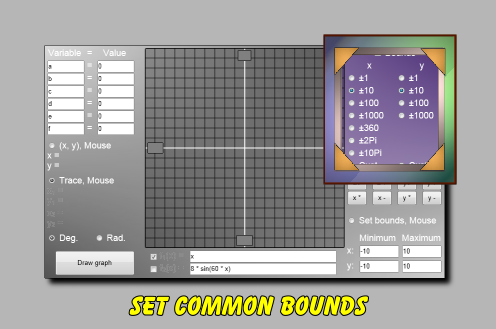
You can change the values for the minimums and maximums of the x- and y-axes here. Several useful values ready to go for your use. When one of these is checked, an associated graph grid will be drawn on the graph area.
How to adjust the bounds of the graph to any values:
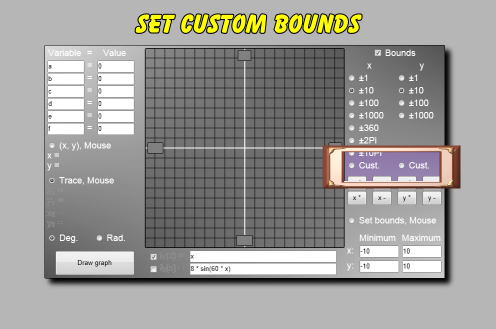
These buttons let you set the bounds for the graph to any values. Whatever values that appear in the lower right minimum and maximum boxes will be used to set the bounds. Click one of these x or y custom radio buttons, and the graph bounds will be adjusted to the values in these lower right boxes.
You can edit the maximum and minimum boxes in the lower right to any valid values. The maximum must be greater than the minimum. Then click the associated custom bounds radio button, and the graph will be redrawn with the bounds that you just entered.
No graph grid is drawn for custom bounds.
Several operations within EZ Graph also cause it to switch to custom bounds.
Another place to see and set the graph's bounds:
The current bounds for the (x, y) graph are shown here. (The bounds also appear on the graph area if the 'Bounds' checkbox is checked.)
You can change these bounds and then click the associated custom bounds buttons to redraw the graph using any valid bounds that you please.
How to zoom and shift the bounds for the graph:
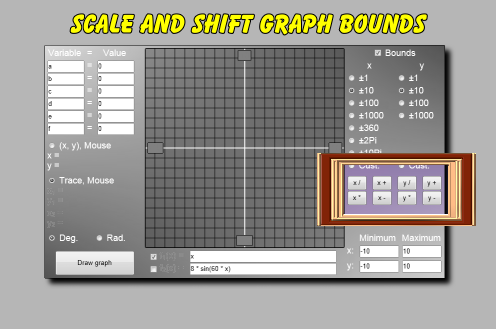
These buttons let you easily change the bounds of the graph by zooming in or out, or by shifting right or left.
The buttons for the x-axis and y-axis both work similarly. Here's how the x buttons operate:
| Button | Meaning | Operation |
| x / | zoom in | bounds become half their values |
| x * | zoom out | bounds become twice their values |
| x + | shift right | bounds are added to equally |
| x - | shift left | bounds are subtracted from equally |
Clicking one of these buttons makes EZ Graph go into a custom bounds mode, and, therefore, no graph grid is drawn.
How to get an accurate function value:
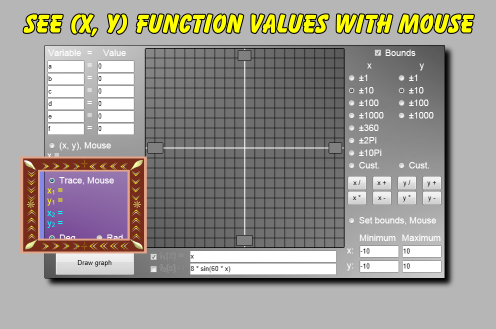
Activate this radio button, draw the function(s), and then click on the graph. EZ Graph will use the x-coordinate where you clicked and calculate the corresponding y-coordinate for the function(s). The coordinate values are displayed in this area, and they are color coded to the functions.
A small point marker will appear on the function(s) showing the location of the coordinates.
How to adjust the bounds for the graph using the mouse:
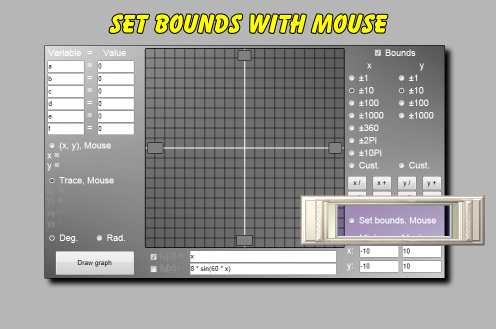
Activate this radio button and then drag the mouse across the graph area. A rectangle will be drawn as you drag. This rectangle represents a new set of bounds. Quit dragging and click inside of the rectangle. The graph's bounds will be set to the custom bounds that the rectangle represented.
This is a very easy way to zoom into a section of the graph.
How to calculate with angles using degrees or radians:
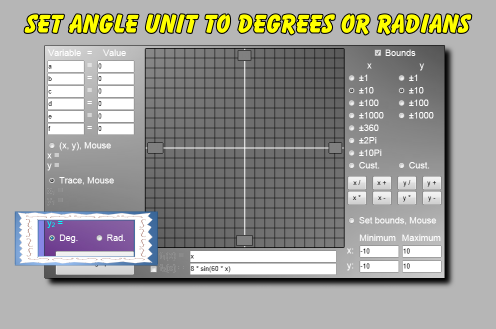
The trigonometry functions (sin, cos, tan, asin, acos, atan) work with degrees or radians. Select the angle unit using these radio buttons.
Basically, you type a function into the 'y =' field, select the 'Use' choice, press the 'Draw Graph' button, and the graph of that function is drawn.
For example, if you type '2 * x + 4' (no quotes) into the top 'f1(x) =' field, check the associated checkbox, and click the 'Draw Graph' button, a straight line graph with a slope of 2 and a y-intercept of 4 will be drawn.
The function expression that you enter would almost always have an x variable in it.
The following arithmetic operations work with EZ Graph:
| Symbol | Meaning | Example |
| + | addition | 3 + 5 evaluates to 8 |
| - | subtraction | 8 - 2 evaluates to 6 |
| * | multiplication | 3 * 5 evaluates to 15 |
| / | division | 8 / 2 evaluates to 4 |
| ^ | raise to a power | 3 ^ 2 evaluates to 9 |
| + | also positive | +5 evaluates to positive 5 |
| - | also negative | -8 evaluates to negative 8 |
The order of arithmetic operations proceeds as follows:
The operator at the top of the following table has the highest precedence. The order of precedence lessens as you go down the table.
| Operator | Meaning | Precedence |
| ( ) | parentheses | highest precedence, can be nested. |
| ^ | raise to power | after parentheses, proceeds left to right. |
| + and - | positive and negative | after raise to power, proceeds right to left. |
| * and / | multiplication and division | after positive and negative, proceeds left to right. |
| + and - | addition and subtraction | after multiplication and division, proceeds left to right. |
So, for example, 4 + 2 * -3 ^ 2 evaluates to -14.
EZ Graph supports parentheses.
To say that parentheses have the highest order of precedence means that calculations within parentheses are performed first.
For example, (2 + 5) * 3 evaluates to 21.
While 2 + 5 * 3 evaluates to 17.
Common trigonometric functions are supported by EZ Graph. These functions include sine, cosine, tangent, arcsine, arcosine, and arctangent.
The trigonometric functions will work with angles measured either in degrees or radians. This choice is made by selecting the 'Degrees' or 'Radians' button.
Assuming that 'Degrees' is selected, this is the meaning of the following trigonometric functions:
| Example | Meaning |
| sin(30) | sine of 30 degrees |
| cos(60) | cosine of 60 degrees |
| tan(45) | tangent of 45 degrees |
| asin(0.5) | arcsine of 0.5, returned in degrees |
| acos(0.7071) | arccosine of 0.7071, returned in degrees |
| atan(1.0) | arctangent of 1.0, returned in degrees |
If 'Radians' is selected instead of 'Degrees', then the sine, cosine, and tangent functions would accept radian angle measurements, and the arcsine, arccosine, and arctangent functions would return angles measured in radians.
Exponential and logarithmic functions are supported by EZ Graph.
Here are some descriptive examples:
| Example | Meaning |
| exp(3) | e raised to the exponent of 3 |
| ln(20) | natural logarithm of 20 |
| log(30) | base 10 logarithm of 30 |
The square root of a number works this way in EZ Graph:
| Example | Meaning |
| sqrt(3) | square root of 3 |
These operations and functions may be combined freely. For example:
sin(cos(ln(2 + 3^4))) * 3^2 * 3 + sqrt(cos(-45))
If you type in something incorrectly, such as ton(30) instead of tan(30), an error message will appear on the graph. This message will include the part of the expression where the error occurred.
Sometimes a semicolon will be indicated as the part of the function where the error occurred, even though a semicolon does not appear in your function. This just means that the error occurred at the very end of your function.