Simple Data Graph Maker
Here is a very simple data graph maker. Basically, you enter your legends, maximums, minimums, and data, and then you press the 'Make graph' button. A new browser window will open up with your graph displayed in it. Simply print the page using the services of the new browser window, and you will have a hard copy of your graph.
Close the new browser window when you are done. This page remains displayed in this original browser window.
Suggestions and help:
- Data points are plotted with this character: '*'.
- Use font size 1. Graphs made with this small font seem to print best on most equipment.
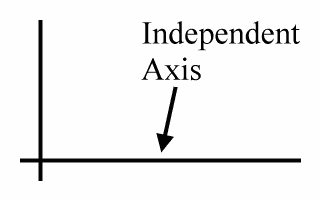
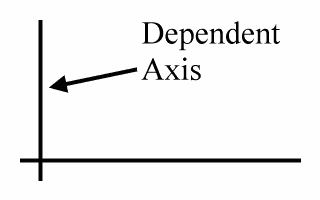
- The independent axis is the horizontal axis, usually called the x-axis in algebra. (Beware: In physics x usually means position and is often graphed vertically.). The dependent axis is the vertical axis, usually called the y-axis in algebra.
-

-

- The syntax for entering data points works like this: If you want to enter point (4.2, 8.5), then on one line in the text box used for data entry write '4.2, 8.5;' without the quotes. That is, type in four point two comma eight point five semicolon. The comma between coordinates and the semicolon at the end are important. Put one data point on one line in the text box.
- You can graph up to 100 points.
- Round your minimums and maximums so they easily extend over the range of your data. The difference between each minimum and its corresponding maximum should be evenly divisible by 5 for the graph tic mark values on the axes to look good.
- This graph maker works with a fixed width text font, and therefore the placement of the points is not perfect; it is rounded to the nearest text row and column. The graphs are hardly useless, however. You will get a good idea of how your data looks, and the graphs are meant to be easy to print on almost all equipment.
- If you want to see how the whole thing works, just click the 'Make graph' button. The graph maker defaults to a simple position vs. time, or x vs. t, graph.